Electric View Bios
|
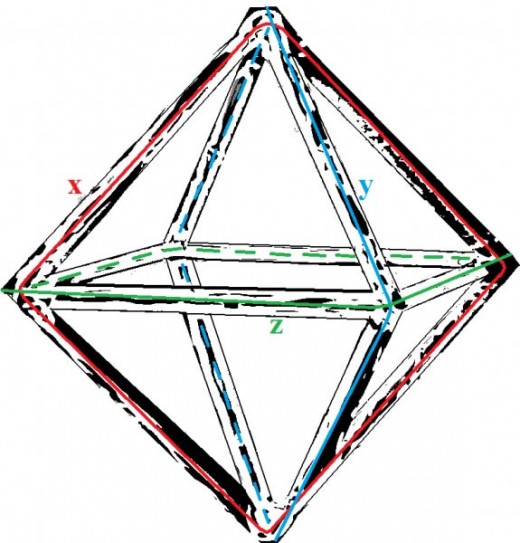
The Delta-T Antenna The Delta-T antenna is the device of legend from 'Project Phoenix'. The device consists of 3 antennas or coils each at 90 degrees to the other. The main two are fed a sine and cosine wave so that they are 90 degrees phase-shifted. This starts up a rotational magnetic field in the center of the antennas whose rotational velocity is equal to the input frequency. The third antenna pulls the field into the 3rd dimension. Here is a possible Delta-T configuration: |
https://youtu.be/MZZPF9rXzes
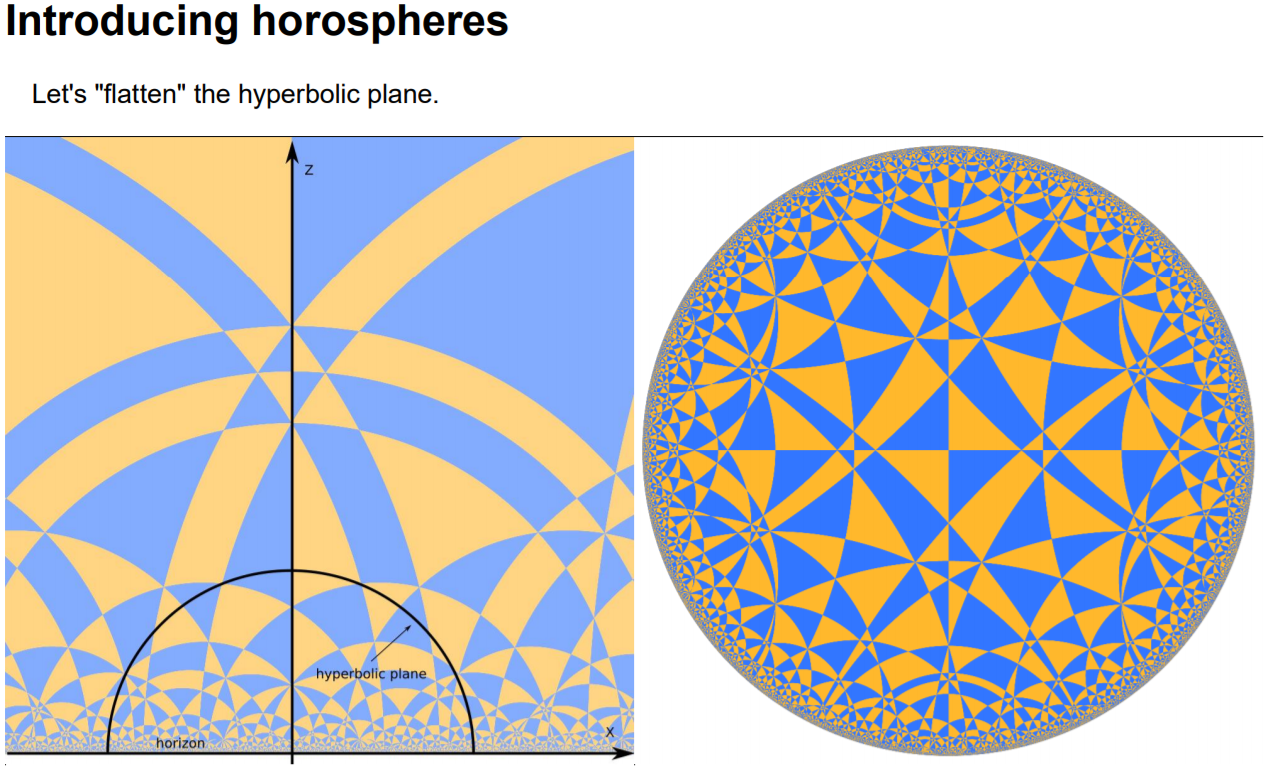
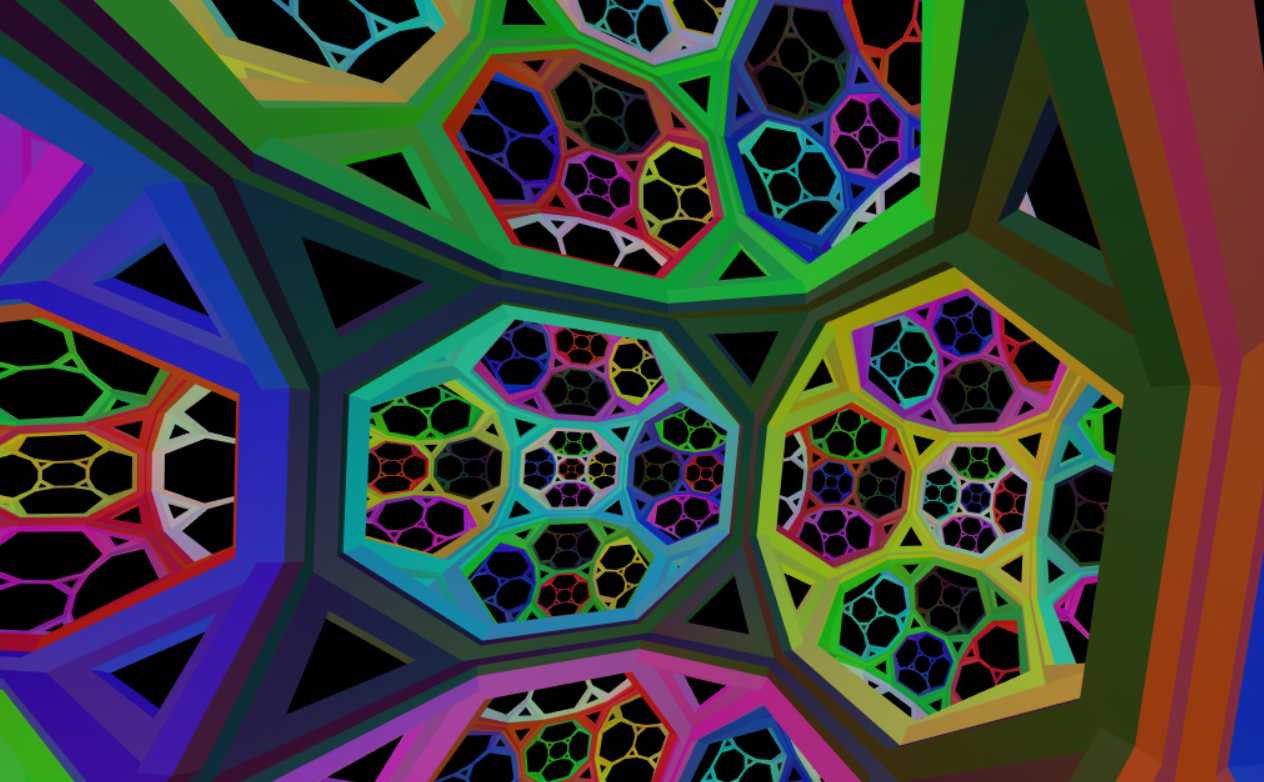
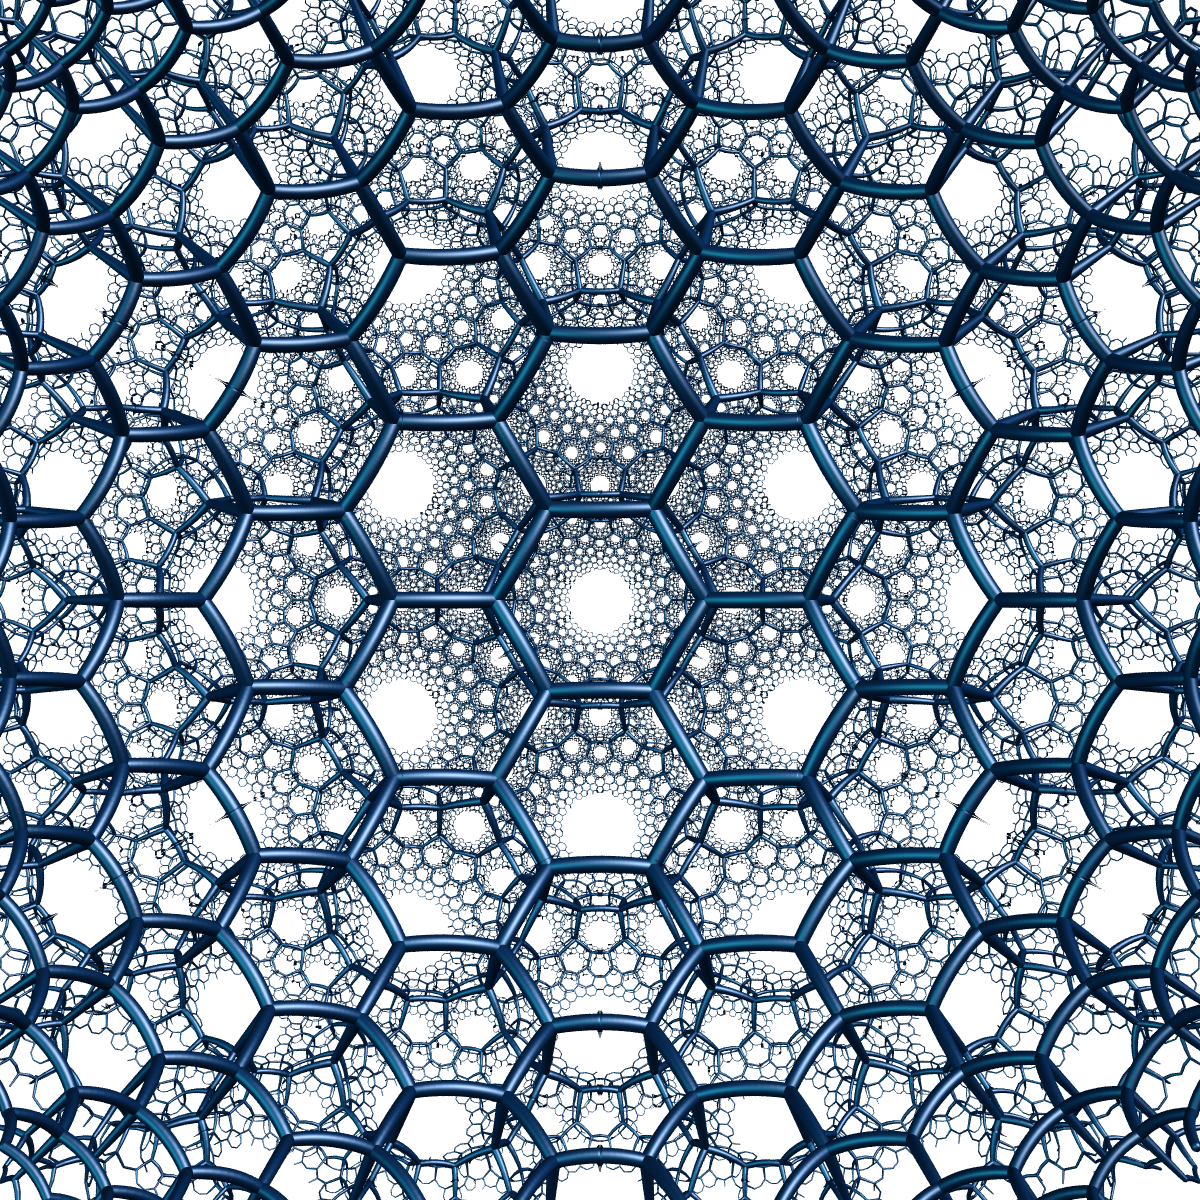
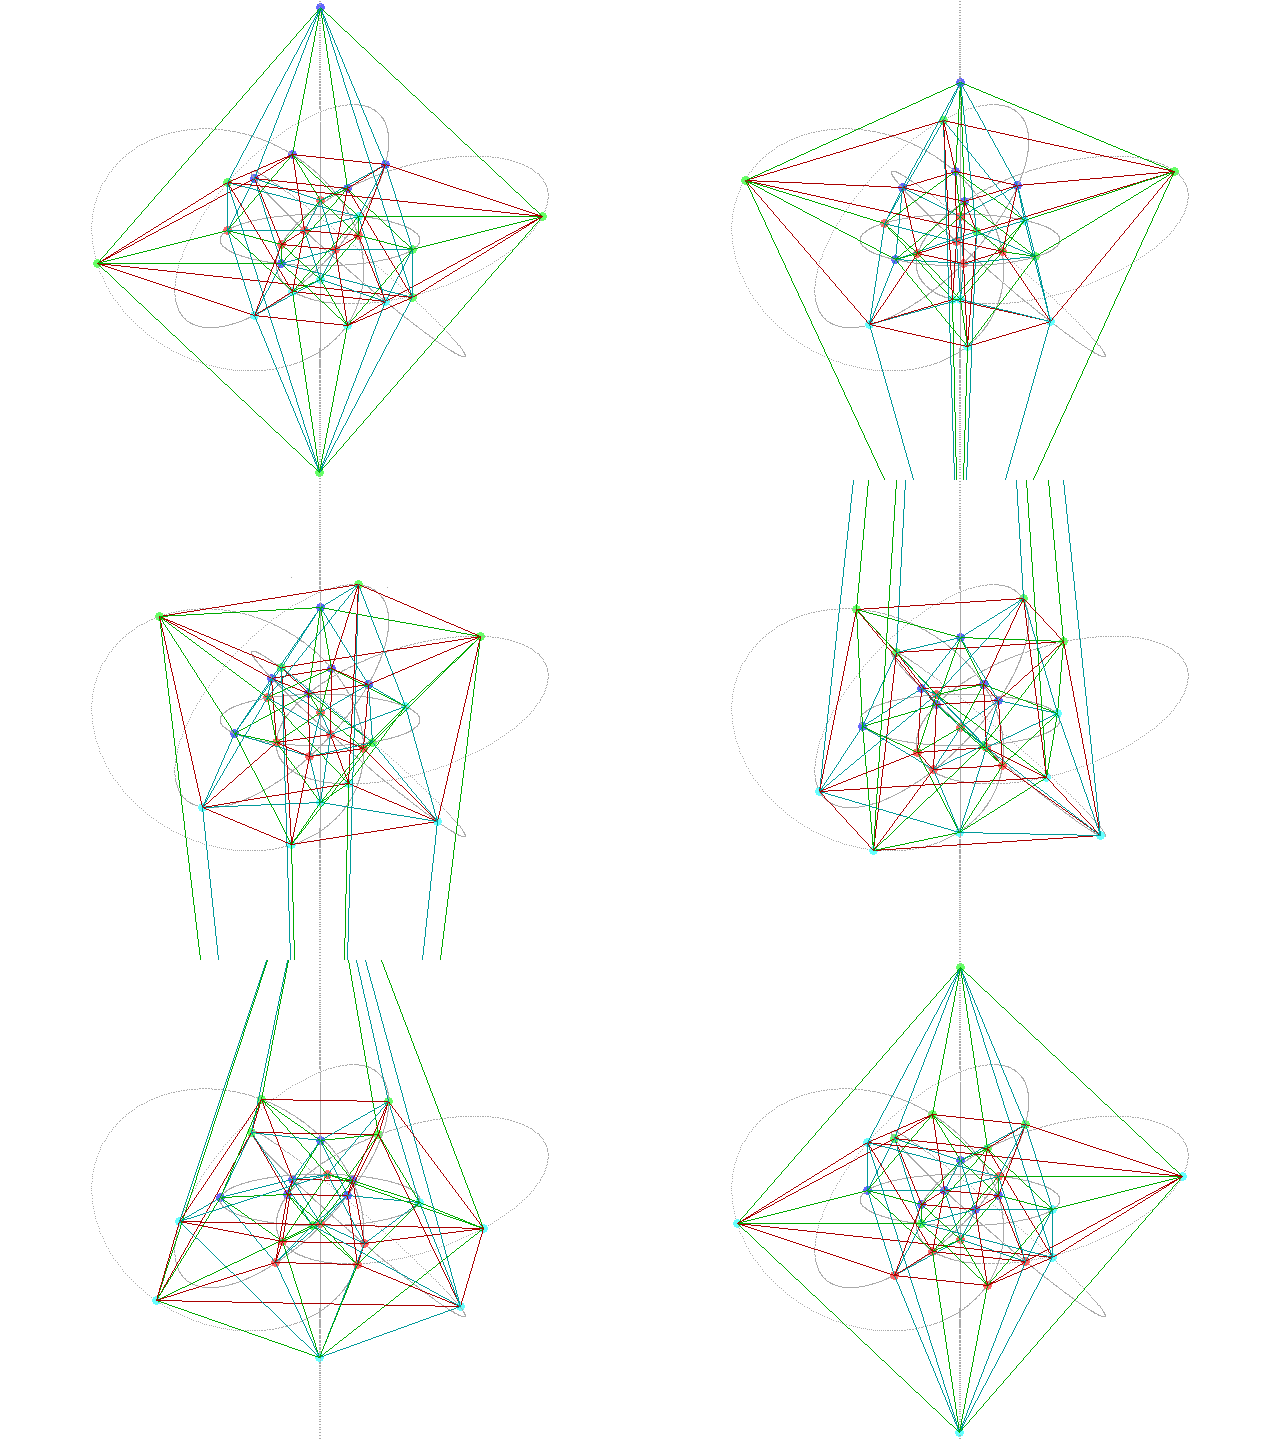
3D Hyperbolic Tiling and Horosphere Cross Section
Vladimir Bulatov,
Shapeways
Joint AMS/MAA meeting
San Diego, January 10, 2018
https://skfb.ly/6xZEx
https://skfb.ly/6sEtC
https://youtu.be/zl12OIYNkLU
From: Chris Reeve <chris@controversiesofscience.
Date: Fri, Apr 13, 2018 at 8:36 AM
Subject: Re: plasma simulations
To: "David W. Johnson" <dj@argos.vu>
Can you point me to the podcasts?
On Apr 9, 2018, at 2:04 PM, David W. Johnson <dj@argos.vu> wrote:Chris,
Great to hear from you.I've looked at Jupyter note books only peripherally and wanted to get a little bit of a closer view. What you are proposing would certainly provide an intuitive method of understanding EU concepts since most are by nature 3 dimensional,I did a little searhing around this morning after receiving your email and put this together this page to trace my steps:I have been looking at how to visualize specific attributes of plasma dynamics for a while now and would enjoy showing you what I've developed.We have been forming a bit of an informal EU collective with Neil Thompson and Jim Weninger that meets every week - it's recently turned into a loose podcast of sorts as well.Skype seems to work for these meetups since people are for the most part familiar with it. We are able to share what we are working on directly via screen sharing.I code in c# with Unity presently but have dabbled in html5 and js as well. I've been particularly impressed with Toby Schachman's work with html5.I'm finding that there is a bit of a ground swell in positive receptivity to EU concepts personally. I have discussed some of the concepts with quite a number of people over that last year or so and I am consistently seeing light bulbs turn on in their heads.Let me know if you'd like to meet up to discuss things further.Have a great afternoon.🙂/dj<banner.png>
On Mon, Apr 9, 2018 at 10:34 AM, Chris Reeve <chris@controversiesofscience.
com> wrote: Hi, David. Long time no talk! I wanted to ask you a question, if you don’t mind ...
I have been trying to fine-tune my understanding of what blocks a wider consideration of the Electric Universe through various attempts to reach out to people, and the subject seems to return to geometry repeatedly. I recently tried to pitch the EU to a very close friend who is a project manager for NASA’s SOFIA project (where they put an infrared telescope onto an airliner), and I came away with the sense that the geometry arguments are falling flat in the various EU papers — and when this happens, what I see is people adopting a very skeptical stance.Then, I read this interesting article on Wolfram here …I spoke to Theodore Gray, who has since left Wolfram Research to become a full-time writer. He said that his work on the notebook was in part motivated by the feeling, well formed already by the early 1990s, “that obviously all scientific communication, all technical papers that involve any sort of data or mathematics or modeling or graphs or plots or anything like that, obviously don’t belong on paper. That was just completely obvious in, let’s say, 1990,” he said.“It’s been a source of ongoing bafflement and consternation for the past 29 years, that with the exception of a few people who get it, the community at large hasn’t really adopted it,” he said. “It’s incalculable, literally ... how much is lost, and how much time is wasted, and how many results are misinterpreted or are misrepresented.”… and it occurred to me that this sort of matches what I am seeing myself when I discuss the many forms of laboratory plasmas. The article mentions this open source Jupyter platform for embedding simulations and 3d renders directly into papers. I am very much liking the sound of that approach, and am exploring the feasibility of implementing simulations which would connect the dots between the geometry of astronomical objects like sn1987a and the laboratory z-pinch, and then ideally contrast that by rendering the mainstream hydrodynamic model approach.I’ve come to think that I could create a powerful scientific “paper” with this approach, which would be a sort of synthesis between traditional paper (including citations, abstract, etc), but taking care to define all of our terms, and presenting all of the most powerful arguments I have come across in my many online interactions.I was wondering if you guys had any experience with Jupyter notebooks, or if you would be able to provide any sort of guidance on how to create these simulations? I’m a little bit lost w/ where to start with such an ambitious endeavor. My matrix math skills are only moderate, but I do have some experience of course with coding. Unfortunately, my Python is pretty weak — yet, it does appear that Jupyter supports JavaScript, which I am much more familiar with.Any pointers on how to proceed w/ creating simulations and 3d animations like this? Am I completely out of my league w/ this? Should I be doing some sort of modeling or 3d animation courses first?If I could somehow get experience with this Jupyter platform, then there is also the possibility of working this capability into the social network that I am constructing ...chris

