From:
- Scott W. McIntosh
- William J. Cramer
- Manuel Pichardo Marcano
- Robert J. Leamon
-
Nature Astronomy volume1, Article number: 0086 (2017)
doi:10.1038/s41550-017-0086
- Received:
- Accepted:
- Published:
Abstract
Rossby waves are a type of global-scale wave that develops in planetary atmospheres, driven by the planet’s rotation1. They propagate westward owing to the Coriolis force, and their characterization enables more precise forecasting of weather on Earth2,3. Despite the massive reservoir of rotational energy available in the Sun’s interior and decades of observational investigation, their solar analogue defies unambiguous identification4,
Coronal brightpoints (BPs) permit the tracking of the magnetic activity bands of the 22-year magnetic cycle of the Sun8. These activity bands in each solar hemisphere undergo significant quasi-annual instability, which results in episodes of intensified space weather6. The nature of the instability on the bands is unknown, but has been linked to the existence of magnetic Rossby waves in the solar interior5. We use our BP detection algorithm9 on a series of coronal images taken by the Extreme-Ultraviolet Imager (EUVI) instruments10 on the twin STEREO spacecraft, and by the Atmospheric Imaging Assembly (AIA) instrument11on the SDO spacecraft, in the 19.5- and 19.3-nm channels, respectively, from 1 June 2010 to 31 May 2013. During this time period, the orbits of these three spacecraft created an opportunity to explore global-scale solar phenomena. In concert, the trio of spacecraft provided the first complete observational coverage of the Sun’s corona, slowly drifting apart from the Sun–Earth line until STEREO-Behind lost communication with the Earth in mid-2014.

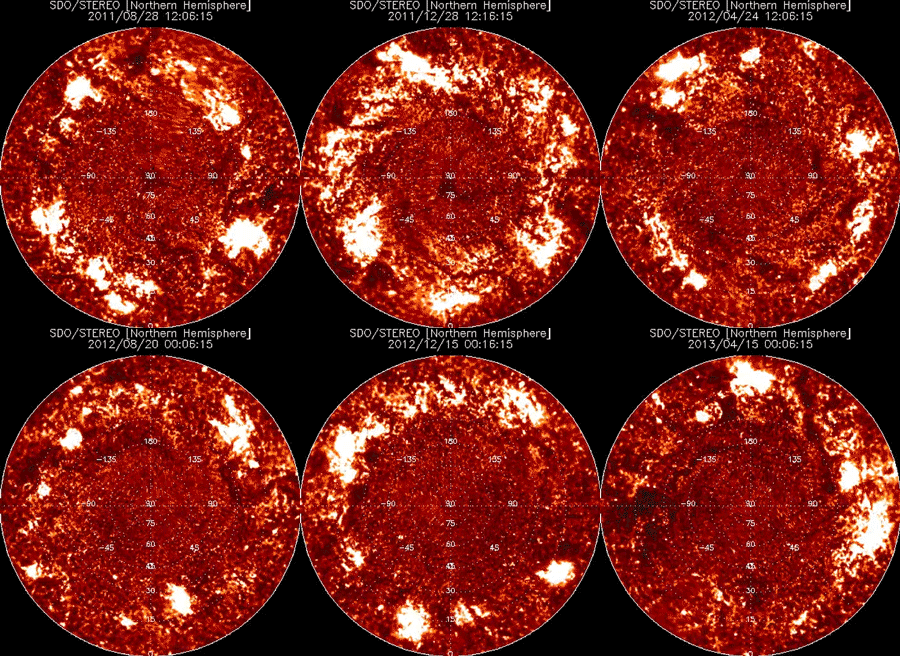
Figure 1 shows an example of BP detection for the three spacecraft on 2 February 2011 in these channels, which are highly sensitive to emission from coronal plasma formed at about 1.5 MK. Repeating our combined BP analysis for images taken daily (at 00:00 UT), we can compile surveys of BP density at all heliographic longitudes and latitudes. Figure 2shows a single-day AIA/EUVI longitude–latitude BP distribution from 22 January 2012 (Fig. 2a), together with a BP density distribution accumulated over a 28-day period on a 2º × 2º longitude–latitude grid (Fig. 2b) centred on the same date. Figure 2c and d shows the pole-on projections of panel B of a 1º × 1º longitude-latitude BP density distribution for the southern and northern hemispheres, respectively. Supplementary Movies 1–4 illustrate the progression of these figure panels over the timeframe studied. Supplementary Fig. 1 shows the evolution of the BP density distribution at a heliospheric longitude of +72° and demonstrates that the BP density clusters associated with active regions are recurrent in time at the same longitude, or are persistent features for a lengthy period of time — behaviour that is repeated at all heliographic longitudes as seen in Supplementary Movie 5.
BP detections by the STEREO and SDO spacecraft taken around 00:00 UT on 2 February 2011 when the entire solar corona could first be seen by all three spacecraft. The top row (a–c) shows coronal images from a plasma formed around 1.5 MK. The small bright concentrations seen in these images are BPs. The bottom row (d–f) shows the same images with respective BP detections15 shown in red (STEREO-Behind), white (SDO) and blue (STEREO-Ahead).
The figure shows a longitude versus latitude snapshot of three-spacecraft BP identification and solar-rotation-averaged BP density for observations taken at 00:00 UT on 22 January 2012. a, BPs from SDO/AIA (black) and STEREO/EUVI (red, STEREO-Behind; blue, STEREO-Ahead). The vertical dashed lines indicate the central longitudes observed by each spacecraft. b, The comparable, 28-day averaged BP density centred on the same date (on a 2° × 2° grid). c,d, The pole-on projections of the BP density (on a 1° × 1° grid). Panels a and bshow horizontal dashed lines at ±55° latitude and a dotted line on the equator for reference. Supplementary Movies 1–4 illustrate the temporal evolution of the panels in this figure.
A standard diagnostic in terrestrial meteorology lies in the ‘Hovmöller’ diagram12, which displays atmospheric variables for all sampled longitudes at fixed latitude (see Methods section). In Fig. 3, we show two such diagrams for the AIA/EUVI BP density distribution averaged over 2° around +15° and −22° latitude, respectively. In each panel, we see the BP density clusters tilt from left to right (east to west) over their lifetime, while there are groups of clusters, or trains, that appear to drift in the opposite direction. We note that the difference between the number of clusters present in the northern and southern activity patterns is due to the 2-year phase lag in the magnetic variability of the solar hemispheres13,14.
Hovmöller12 diagrams (longitude versus time at fixed latitude) are shown for the BP density distributions derived from 360° solar observations. a, The Hovmöller diagram for a band of latitudes 2° wide that is centred on 15° in the northern hemisphere; b, the corresponding Hovmöller diagram for 22° in the southern hemisphere. In both cases, we see that the clusters of enhanced BP density exhibit a westward (left-to-right) phase velocity over their lifetime, while there is an apparent eastward (right-to-left) group velocity. Analysis of the cluster shape yields a westward phase velocity of approximately 3 m s–1 (red dashed reference line), whereas the analysis of their longitudinal separation yields an eastward group velocity of approximately 24 m s–1 (white dashed reference line) in each hemisphere (see Methods section).
Isolating well-defined clusters of BPs and fitting ellipses to their shape, we are able to use the tilt angle of the fitted ellipses to derive average westward phase velocities of 3.25 ± 2.25 m s–1 and 2.65 ± 1.60 m s–1 for clusters in the northern and southern hemispheres, respectively (see Supplementary Fig. 2). We detect no significant change of the phase velocity with latitude or time for the samples studied. For reference, we show straight lines of apparent westward phase velocity 3 m s–1 (red dashed lines) on the panels of the figure that are developed from Supplementary Fig. 2. These wave phase velocities are consistent with other meandering velocities recently identified in the solar interior15and add support to the assertion that BPs trace global-scale flows and magnetism8. The presence of such features propagating in longitude is indicative of the presence of global-scale rotationally driven wave modes in the solar interior12,16. In this case, that is a magnetized Rossby wave, as we are observing the modulation of a rotating, convecting plasma5,17,18. Indeed, a theoretical relationship between the toroidal magnetic field strength at the bottom of the solar convection zone and the 3 m s–1 phase velocity of the magnetized Rossby waves5 would yield magnetic field strengths of the order of 4 kG, consistent with that measured in the strongest of sunspots19.
Further, the clusters of BPs visible in Fig. 3 appear to demonstrate group, or wave-train, behaviour. To estimate the apparent group velocity of the BP clusters, a cross-correlation technique20 is used on the Hovmöller diagrams (see Methods section). In this instance (see Supplementary Fig. 3), the method yields apparent eastward group velocities of 24.4 (±15.3) m s–1 and 23.8 (±20.8) m s–1 for the southern and northern hemispheres, respectively. The anti-directed phase and group velocities of the drifting motions observed are another signature of Rossby-like waves1,21.
Figure 4 shows the statistical properties of the BP clusters in the samples studied above (see Methods section). The figure shows that the well-defined BP clusters have lifetimes that appear to be integer numbers of the Sun’s rotational period of 28 days, and have a mean longitudinal separation of 65° over the period of time sampled, for the latitudes shown. This whole-integer dependence of the BP cluster lifetimes when combined with the magnitude of the inferred wave phase velocity (~3 m s–1 westward) indicates a strong connection with seminal observational investigations of the Sun’s ‘torsional oscillation’22,23 — a long-held characteristic of the Sun’s global-scale evolution and the extended solar cycle24.
a, Histogram of the ellipse lifetimes; b, central positions, for the hemispheric examples shown in Fig. 3 (see also Supplementary Fig. 1). In each case, we show the distributions for the northern hemisphere (red), southern hemisphere (blue) and their sum (black).
We have observed long-lived, slow-moving, westerly features in the combined observations of STEREO and SDO. Those wave-like patterns closely resemble the diagnostics of Rossby wave trains in the Earth’s atmosphere12,25. The properties determined from these combined STEREO and SDO observations would appear to intrinsically link the formation and evolution of individual solar active regions with the Rossby-like behaviour of the activity bands of the 22-year magnetic activity cycle in each solar hemisphere26 and to indicate that both are driven by the rotation and the induced global circulation of our star’s convective interior. Furthermore, observations of such propagating patches of strong, well-separated, recurrent magnetic activity should help to reconcile the decades of ‘Rieger periodicity’27, ‘active’ solar longitude26,28 and ‘active region nest’29,
This finding explicitly ties the present analysis to that of previous work8, extending and reinforcing the spatio-temporal connection between the BP density distribution and the torsional oscillation through the magnetic bands belonging to the 22-year (extended) magnetic solar cycle. The rotational timescale dependence of BP cluster emergence and lifetimes found here also ties the present analysis to the modulation of solar activity on timescales of years and months6. We deduce, then, that the motions being observed are the solar analogue of a terrestrial Rossby wave — a magnetized Rossby wave — and allow us to connect the disparate timescales of solar variability.
Monitoring the wavenumber of disturbances present in the Sun’s global weather patterns and understanding their magneto-hydrodynamic origins through a three-dimensional rotating stratified solar interior are critical elements to increase the predictive skill of solar activity to a level that is required to protect our technological society33. Progress in this area requires that we adopt a continuous presence in space that provides global observations of our star, sampling all longitudes and local times, just like those that drove the advances in terrestrial meteorology in the last half of the twentieth century34.
Methods
Hovmöller diagrams
The analysis presented herein relies on the extraction of information from Hovmöller diagrams12 — a common means of plotting meteorological data to highlight the role of waves. The axes of the Hovmöller diagrams presented are longitude (abscissa) and time (ordinate) for fixed latitudes. In other words, they are space–time plots that illustrate the evolution of a spherical dynamical system over a narrow range of latitudes, in which the resulting circular band of information represents the complete longitudinal evolution of the system with time. These diagrams were used to illustrate the global migration of pressure ridges and seasonal rainfall migration patterns across the world when computer-aided animations of the Earth’s spherical system were not possible. Slanting straight lines in a Hovmöller diagram, like any space–time plot, indicate a succession of disturbances that are propagating.
Hovmöller diagrams constructed from the combined STEREO/EUVI and SDO/AIA BP density data are shown in Fig. 3 with two dashed lines. The red dashed lines represent the apparent phase velocity of the clusters of BP density, and the white dashed line is a representation of the group velocity of those clusters, although this dataset makes definitive determination of the latter difficult. In the following paragraphs, we will discuss the method used in the derivation of these slopes.
Wave phase velocity estimation
Estimation of the apparent phase velocity of the wave can be derived from the inclination angle of the clusters in the Hovmöller diagrams. Following the identification and isolation of distinct regions of BP density that exceed the value of 5 BP per day per degree, we numerically fit an ellipse to the enclosed cluster of points to measure their lifetime and the tilt angle subtended by the cluster to the vertical. The tilt angle provides a measure of velocity: a cluster that is parallel to the ordinate demonstrates no motion in longitude, whereas a westward motion would slant from left to right and an eastward motion would slant, conversely, from right to left. In Supplementary Fig. 2, we show the fitted ellipses to the easily identified BP density clusters in the northern (red ellipses in Supplementary Fig. 2A; 95 in number) and southern solar hemispheres (red ellipses in Supplementary Fig. 2C; 67 in number) from the data presented in Fig. 3. We see that the vast majority of the clusters appear to slant left to right in both cases. To characterize the mean value of the slant of these clusters in each hemisphere, we present, in Supplementary Fig. 2B and D, histograms of the collected tilt angles (θ) converted into velocity (velocity = tan θ = range of cluster longitude / cluster lifetime; a velocity in radians per year is easily converted into metres per second). Fitting a Gaussian function to the tilt angle distributions (thick solid line) indicates a mean velocity of 3.25 (±2.25) m s–1 in the northern hemisphere and 2.65 (±1.6) m s–1 in the southern hemisphere. These mean values are shown in the figure as thick dashed vertical lines in the corresponding panel. These slow, non-zero, motions of the BP density clusters we identify with the westward phase velocity of the waves in each hemisphere of the Sun.
There appear to be other drifting patterns in the Hovmöller diagrams, but their determination in this dataset is difficult and probably not unique. From the reference lines shown in Fig. 3, we see that the 3 m s–1(red dashed) line can allow us to associate many clusters as possibly belonging to a train; thus the disturbances could have a westward group velocity close to 3 m s–1. However, there may also be eastward-travelling trains of BP density clusters (see below).
We note that it is possible to detect such small velocities in data that have a low spatial resolution, of the order of hundreds of kilometres per image pixel in all three spacecraft, because the clusters of BPs persist for so long that we are able to characterize their collective motion.
Cluster properties
The ellipses identified in the process above provide us with information about the lifetimes of the events that give rise to the BP clusters, presumably magnetic flux emergence from the Sun’s interior, and their effect on coronal structure. In Fig. 4a, we show the histogram of cluster lifetimes, derived from the fitted ellipses. In both hemispheres, there are notable peaks at approximately 28 days and 56 days (or approximately one and two solar rotations), with the latter having about one-quarter the amplitude of the former. Similarly, we can infer (as shown in Fig. 4b) that there may be some spatial dependence in the clusters. For the sampled latitudes (and times), there appears to be a mean separation of clusters of ~65° in each hemisphere. These values seem to indicate that the approximate wavenumber of the disturbances observed in the EUV BP density is, on average, 5. In combination, these factors will be useful in subsequent theoretical efforts to study, in more detail, the wave modes that are present.
Wave group velocity estimation
In an effort to isolate this possible eastward disturbance, we average over a slightly broader range of latitudes to build the Hovmöller diagrams shown in Supplementary Fig. 3. Here the average is over a 5° wide range of latitudes centred on 12° (northern hemisphere) and 25° (southern hemisphere) to increase signal. We then cross-correlate the time series of BP density at any reference time with that 7 days (seven time steps) later, following a prescription for identifying apparent velocities in space–time plots20. The resulting cross-correlation function has a peak at the longitude that may correspond to the staggered progression of the moving wave train. A parabolic fit to the centroid of the cross-correlation function permits an estimate of the instantaneous velocity for that time to be computed (again, velocity = longitude/time). Repeated for all time steps, we see the variation of the instantaneous velocities in Supplementary Fig. 3B and E, in which the colour-coding of the points indicates the amplitude of the fitted cross-correlation function. Supplementary Fig. 3C and F shows the histograms of the instantaneous velocities, where the cross-correlation peak is greater than 0.9. A Gaussian function is fitted to the histograms (thick red line) to reveal the mean and standard deviation of the apparent motions in the diagram for each solar hemisphere at the selected latitudes. The value of this apparent eastward-travelling motion, possibly the group velocity of the wave, is ~24 m s–1 (24.4 ± 15.3 m s–1 in the north and 23.8 ± 20.8 m s–1 in the south) and motivates the white dashed lines drawn on Fig. 3. However, we note that a dataset that could discriminate between magnetic polarities of features covering the Sun, rather than one impacting EUV brightness of the corona, could resolve this issue.
Data availability
The imaging data used in this paper are freely available from the STEREO and SDO mission archives and the Virtual Solar Observatory (http://virtualsolar.org). The processed data that support the plots within this paper and other findings of this study are available from the corresponding author upon reasonable request.


