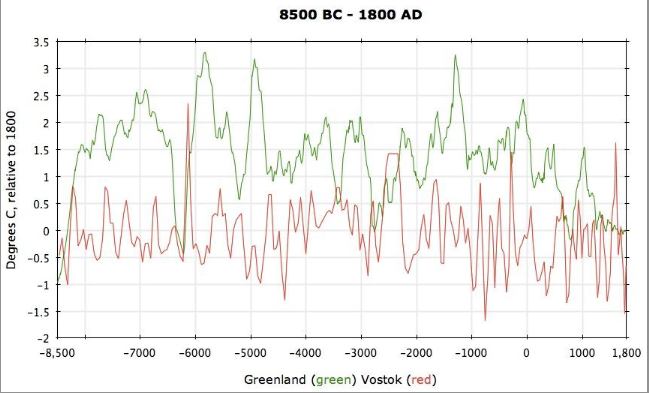
The most reliable long-term temperature record we have comes from ice core data. The charts presented here are based on data downloaded from the World Center for Paleoclimatology, Boulder. The Antarctic dataset comes from Vostok, and goes back 420,000 years. The Arctic dataset comes from Greenland, and goes back 50,000 years. Both datasets are useful up until about 1880 AD. Vostok temperatures are shown in red; Greenland temperatures are shown in green.
The temperatures shown for each dataset are expressed in degrees centigrade, relative to the dataset’s temperature in 1800 AD, which is shown as zero. The years are expressed as a calendar date, negative indicating BC. Only values up to 1800 AD are shown in these charts, so that we’ll be looking at natural climate variation, prior to any effects that might arise from industrial-era greenhouse gas emissions.
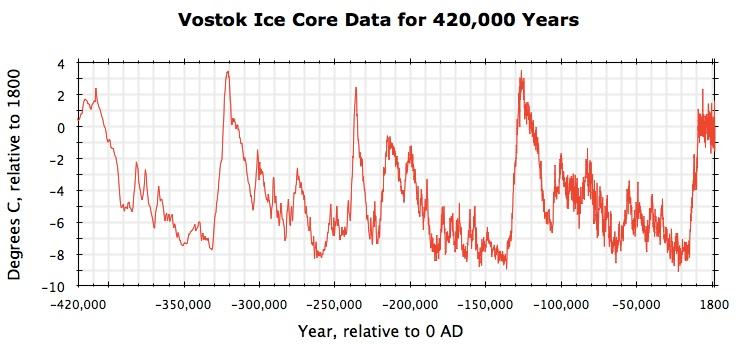
In this long-term record we see a fractal pattern – the same kind of pattern occurring on different scales. On the largest scale, we a sequence of first-tier temperature spikes of about 10° C, occurring with an irregular frequency of about 100,000 years. In between these spikes are ice ages, and the tops of the spikes give us our brief inter-glacial periods of about 10,000 years. On a smaller scale we see a similar pattern of second-tier spikes in the range of 2°–5°, occurring with a semi-regular frequency of about 10,000 years. As we’ll see in later charts, this fractal pattern, of semi-regular spikes, continues on ever-smaller timescales.
The past 10,500 years – our interglacial period
This next chart shows our current interglacial period. We are looking under a microscope at the tip of the spike, above, that ended the last ice age. On this more detailed scale, we see again the same fractal pattern of semi-regular spikes, and we see that the patterns are different in the two Polar Regions. In the south we see oscillations extending more or less equally above and below the zero line. In the north we see first-tier spikes occurring about every thousand years. The spikes were rising at the beginning of the period, and have been descending since about 1500 AD, as we approach the end of our interglacial period.
The past 3,500 years – beginning our descent to the next ice age
< In this next chart we zoom in on the declining phase of our interglacial period. Once again, at this highest-level magnification, we see our familiar fractal pattern. In Vostok, oscillations continue around zero, in the range -1.5° to +1.5° C. In Greenland, we have a closer view of the semi-regular series of descending spikes, occurring about every thousand years.

The past 200 years – the industrial age
If climate were to continue to follow its natural patterns, even as we enter the industrial age, what would we expect to see as the chart above continues to the right? We can make no precise extrapolations, in the midst of so much randomness. However, we can take into account the semi-regular patterns.
In Greenland, it is very likely we would see yet another spike in the series, rising approximately 1°-1.5°C above 1800 levels, and peaking around year 2000 – one thousand years after the previous peak in the series. In Vostok, it is likely that the spike we see rising at 1800 would continue rising to approximately 1°-1.5°C above 1800 levels, like the spike that preceded it, which has a similar width.
Thus in both Polar Regions, if natural patterns continued into the industrial age, we would expect temperatures to rise about 1°-1.5°C above 1800 levels, to peak sometime around year 2000, and then begin to decline. And in fact this exactly matches what has happened. Global temperatures have risen about 1°-1.5°C since 1800, and this year the UK Met Office released data showing that temperatures have indeed leveled off over the past decade.
According to the actual temperature record, Earth’s climate has continued to follow natural patterns, right through the industrial age and up to present day. There is nothing in the temperature record to suggest anything unnatural about today’s climate.
The next 200 years
Amidst all the randomness and irregularity in the temperature record, there is one thing that is very regular: the heating spikes are symmetric. They descend about as rapidly as they ascend, and they descend about as many °C as they ascend. This symmetry enables us, with reasonable confidence, to make certain short and long-term predictions regarding climate change.
In the Northern Hemisphere, over the next 200 years, we can expect steady cooling, at about the same rate we experienced steady heating over the past 200 years. In the Southern Hemisphere the ice-core record is too irregular to make short-term predictions. Within a few centuries, however, we will be over the precipice, where the ice-age-ending spike begins its steep descent. Within a couple of thousand years, we will be in the next ice age.
What drives Earth’s pattern of climate variation?
Variations in the Earth’s orbit?
In order to explain the ice age cycle, some scientists have suggested that the cycle might be caused, at least in part, by Milankovitch Cycles – variations in the Earth’s distance from the sun, and variations in the eccentricity of the Earth’s orbit. This cannot be, however, because orbital variations occur smoothly, and with precise regularity. Such variations would not lead to abrupt temperature spikes, and particularly not spikes that occur with an irregular frequency. Any contribution from orbital variations is evidently lost in the noise of the spiky temperature record.
Carbon dioxide?
CO2 is actually a very unlikely suspect for playing a measurable role in climate, given its trace presence of a few hundred parts per million. Water vapor dominates, by a large margin, in the greenhouse gas category, and any contribution from CO2would presumably be, like orbital variations, lost in the noise.
The whole basis for imagining that CO2 might measurably affect climate, boils down to the fact that a heating spike was occurring, at the same time the Industrial Revolution came along. For the past two centuries there has been a correlation between increasing CO2 levels and temperature levels, and the correlation has been entirely coincidental. The naturally expected spike has peaked right on schedule, with no perceptible influence from CO2. Lost-in-the-noise continues to be a reasonable assessment of CO2’s role in climate change.
An argument has also been put forward that there is a long-term correlation between temperatures and CO2 levels. However in the long-term record, temperatures always increase first, and CO2 levels increase as a result, a thousand years or so after the temperatures start increasing. Again, a wrongly interpreted correlation leads to imagining that CO2 might have a measurable effect on climate, even when it only exists in trace amounts.
It is unfortunate that the climate modelers have fallen into the trap of these flawed lines of thinking. Their models begin with the assumption that temperature rises linearly with CO2 levels, which has no basis in fact, and of course the models then predict disaster, as CO2 levels continue to increase with no promise of slowing down any time soon.
As we’ve reached the peak of our two-century spike, and temperatures have leveled off, the climate models are diverging dramatically from temperature reality. But ideas, once entrenched, have a way of stubbornly persisting. Even as relief is on the way, from our heating spell, scientists and the population generally remain in a state of alarm, over the imagined possibility of runaway warming.
Fluctuations in solar output?
The third explanation that scientists have offered to explain climate variation, and it seems the only possibility remaining to us, is variations in the energy output of the Sun. The Earth receives energy from the Sun in two ways. There is radiation from the Sun – the heat we feel when we stand in bright sunlight. There is also the ‘solar wind’, ionized particles that stream out from the Sun, and which then stream into our ionosphere at the poles, creating the Aurorae.
The radiation from the Sun, including infrared and ultraviolet, seems to be a constant, varying by only .1% over its 11-year sunspot cycle. And there are no historical reports of the Sun becoming noticeably brighter or dimmer, even though there have been major climate changes in historical times. It appears that the only variable – the only known source of energy into Earth’s climate system that could possibly account for our pattern of climate variation – is the fluctuating solar wind. In order to understand what the solar wind is, and what drives it, we must turn our attention to cosmology.
Cosmology: Standard model vs. Electric Universe model
The Standard model
The Standard model of cosmology is based on the assumption that gravity is the dominant force in the universe. The model was first developed centuries ago, out of the discoveries of Copernicus, Kepler, and Newton. Gravity explains the motion of the planets and moons in the solar system, and there was no reason to think gravity wouldn’t explain the motions of stars and galaxies as well.
Over time theories were developed, based on gravity, to explain the formation of stars and planets, and to explain the expansion of the universe. As technology improved, and more data was collected about the universe, increasingly elaborate theories were developed to explain how gravity could produce that data. If gravity is the dominant force, these theories tell us, then there must have been a Big Bang, there must be black holes, and most of the universe must be composed of dark matter and dark energy.
With all of our particle accelerators, and all of our delving into the quantum world of subatomic particles, physics has found nothing to indicate the existence of anything like dark matter or dark energy. If those things don’t actually exist, there must be forces other than gravity at work in the universe. This is a possibility, however, that mainstream cosmologists, astronomers, and astrophysicists consistently fail to consider.
They see no need to consider that possibility because so far they have been successful in inventing explanations for nearly all the data. The mainstream view is that everything has been explained about the cosmos – apart from a few minor anomalies that are still being worked on. When a model is so seemingly successful, why would anyone want to waste time considering the possibility that the model is fundamentally flawed?
With the coming of the space age, however, ‘a few minor anomalies’ has grown into an avalanche of anomalies. Many space probes have been sent out to verify one or another of the mainstream theories, and in nearly every case the theories have been thoroughly invalidated by the data.
The Standard model is in trouble. Most of its explanations were untestable before the space age. The space age finally provided the forensic tools to actually test some of the explanations, and the results are coming back overwhelmingly negative. When this kind of thing happens in science, the logical thing to do is to go back to the drawing board and reexamine your assumptions.
But that is not how the mainstream scientists are responding. They simply see work-as-usual ahead, seeking explanations for the new anomalies. If the Standard model is fundamentally flawed, then the mainstream scientists are trapped in a cul-de-sac, by the way they are responding. Any successor model will need to come from the work of others, who are following a different line of inquiry. In other words, conditions are ripe for a paradigm shift in cosmology.
The Electric Universe (EU) model
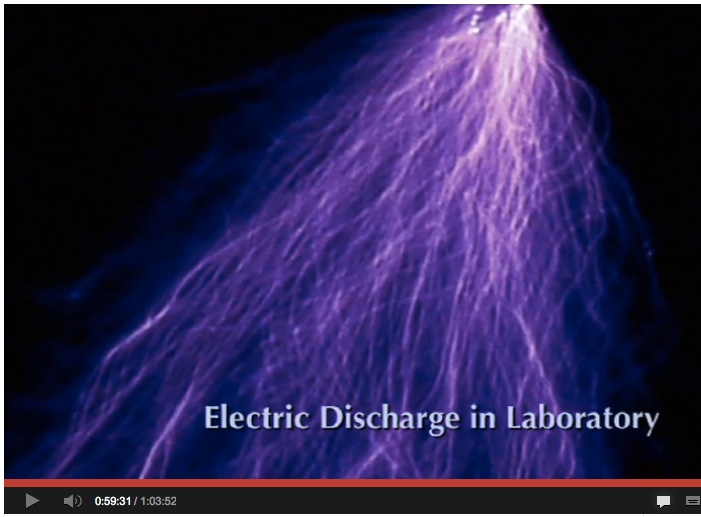
99.99% of the matter in the universe, including all the matter in stars, is in plasma form – ionized particles that respond readily to electric and magnetic fields. When an electric current flows through plasma, the plasma responds in predictable ways. Depending on the strength of the current and other conditions, the plasma forms itself into characteristic configurations. In this image we see a plasma configuration produced in a laboratory.
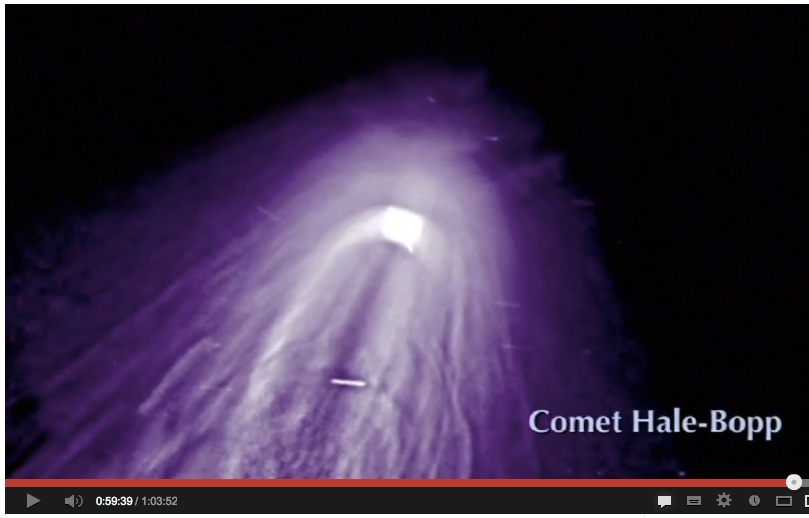
In this next image we see a very similar configuration, observed through a telescope, showing a close-up of a comet’s tail.
In this next image, we a similar configuration, on a still larger scale. Stars are forming along the filaments.
As you can see, these configurations in space look very much like the configuration produced in the laboratory. And one of the properties of plasma is that it behaves the same way on every scale, from microscopic to cosmic. I could show you many similar sets of images, where distinctive plasma configurations are found on various scales in the cosmos.
In fact, everything that has been observed by astronomers, using optical telescopes, radio telescopes, or whatever, makes perfect sense if interpreted as plasma behavior. The Standard model, on the other hand, has a very difficult time trying to explain many of the observed configurations.
Given that most of the universe is in plasma form, and given that what we see in the universe looks very much like characteristic plasma behavior, it makes a great deal of sense to entertain the hypothesis that what we are seeing in space is plasma behavior. And if it is plasma behavior, that means electric currents are flowing through the plasma, energizing the plasma, and causing the behavior.
Not surprisingly, a number of plasma scientists over the years, and a larger number recently, have turned their professional attention to the cosmos. What could be more exciting and motivating than helping develop a new and better model of the universe? The pioneering spirit of Copernicus, Kepler and Newton lives again!
These various scientists, some from plasma physics, and some from electrical engineering and other related fields, have come together in a group research initiative called the Thunderbolts Project. The Project has been going on for some years now, but the core threads of research had been underway before that, by one researcher or another. The Project brought the various researchers together, creating a forum where they could share ideas, collaborate on research, etc.
The EU model is very well developed at this point. The job of such a model, as we saw with the Standard model, is to offer explanations of what we observe. The EU model is now very comprehensive, offering clear and consistent explanations for just about everything that can be observed in the cosmos – and unlike the Standard model, there aren’t any anomalies left over, nor is there any need for mechanisms, like dark matter, that violate the known laws of physics.
Many of the explanations of the EU model, such as those concerning the nature of comets, led to predictions as to what would be found when space probes were able to visit the relevant places and collect data. While the findings of subsequent space probes overwhelmingly contradicted the predictions of the Standard model, they overwhelmingly confirmed the predictions of the EU model. It’s like with the Beagle, Darwin’s ship, whose mission was to find proof of the Bible’s creation story, but the result instead was the discovery of evolution.
The EU model is very well documented on the Thunderbolts Project website. (See ‘Sources’, at the end of this paper.) The EU folks are eager to promote their model, which they see as the rightful successor to the Standard model. As a result, their articles, technical papers, and videos are all presented in clear, understandable terms, so that the principles can be understood, and the arguments can be followed, by anyone who has a reasonable level of scientific understanding.
I recommend especially the videos, particularly if cosmology isn’t something you’re familiar with. For those more scientifically oriented, the ‘Essential Guide’ would be a good early read. For my money, the paradigm shift is here, and the EU model is the future of cosmology. It explains everything so much more simply and elegantly, and without the anomalies and physics-defying assumptions of the Standard model.
The cosmic origins of climate variation
Electric stars
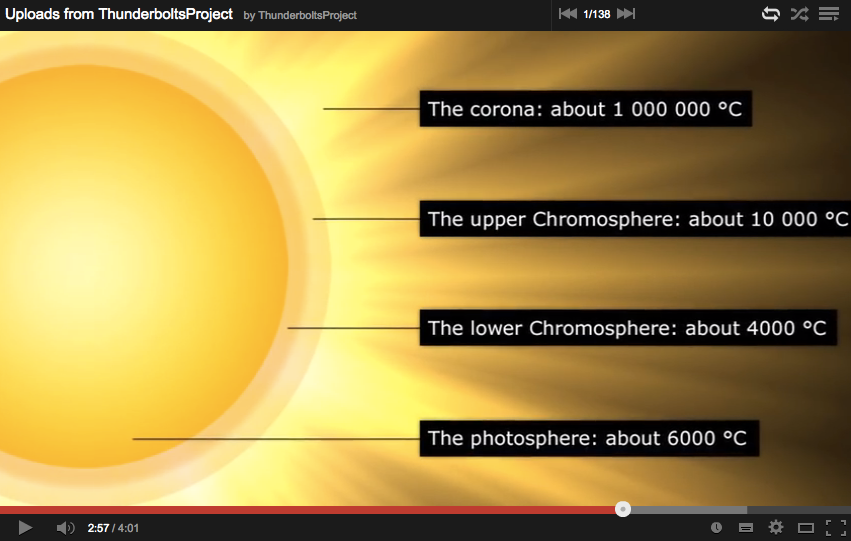
The Standard model’s explanation of stars does not stand up to scrutiny. A star is supposed to be a nuclear furnace, with its energy coming from deep in the interior. And yet the surface of the Sun is extremely cool, compared to the Chromosphere and corona far above it. This defies common sense, and the offered explanations are based on physics-defying assumptions.

In the EU model stars are not nuclear furnaces, rather stars are powered by electric currents. Stars are strung along current filaments, just like Christmas tree bulbs on a wire. A star is a singularity in a circuit, a place where the circuit is discharging. This model matches the observed behavior of the Sun, and stars in general, much better than the Standard model, and without any need for dubious assumptions. Consider again this image, where stars are being formed along current filaments.
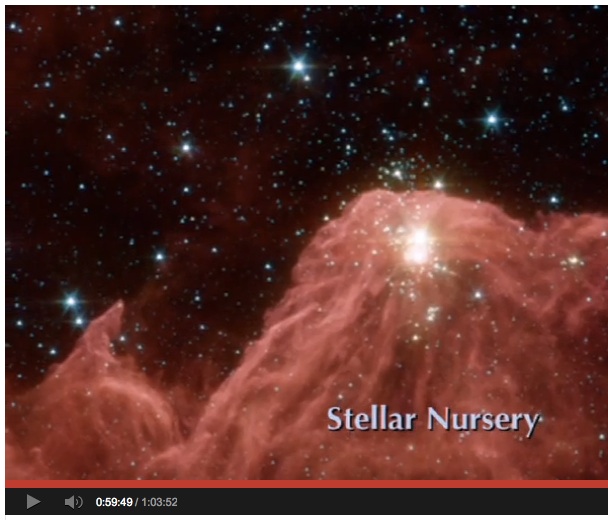
Mainstream scientists published the image, and recognized that stars are being born along the filaments. But they had no explanation for the filaments, or for why stars would form along them. In the EU model, it is likely that stars would form along new, energetic current filaments.
When such a filament encounters a region of space dense in heavy ions, like iron, this causes turbulence in the circuit. Heavy ions are a burden on current flow. It is more efficient for the current to isolate a mass of heavy ions into a star-singularity, than it is for the current to transport the heavy ions. It’s like when a river encounters a boulder. Rather than pushing the boulder downstream, the river goes around it.
Electric planets
The ‘solar wind’ is in fact a sheet of current, flowing outward from the Sun’s equator, being accelerated toward the more negatively charged boundary of the solar system. This sheet of current encounters each of the planets on the way out. In the image below, the blue streaks show how current flows from the Sun, enters the Earth’s ionosphere at each of the poles, exits the ionosphere from the equator, and then continues outward, rejoining the current sheet.
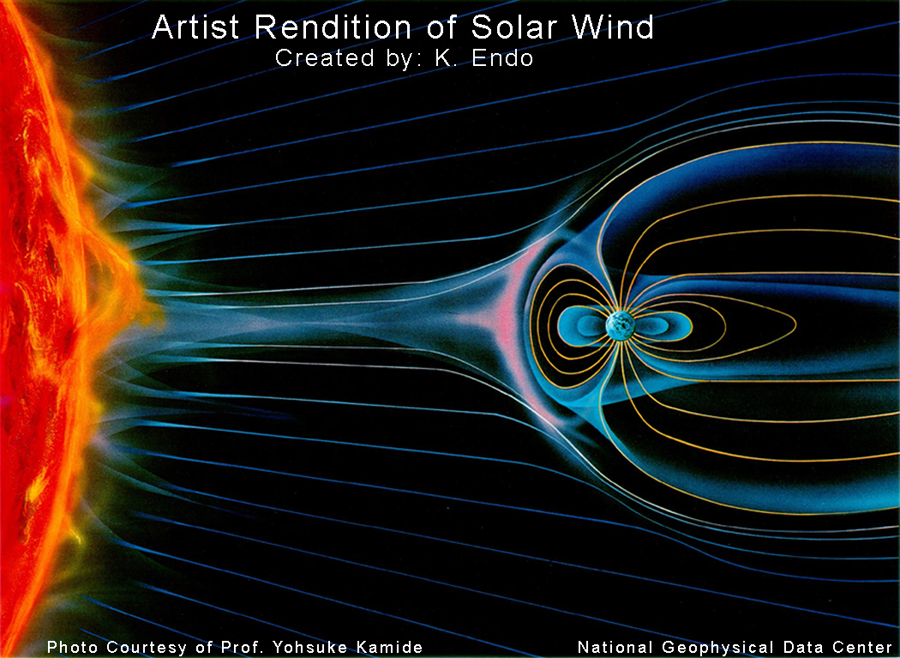
Similarly, a current enters the Sun’s corona at each of the poles, and then exits at the equator, just as with the Earth, but on a larger scale.
Why solar radiation is constant
The Sun is a singularity in its current filament, causing turbulence, like a boulder in a stream. Most of the current flows around the solar system, avoiding the turbulence. The part that goes into the solar system comes into the Sun’s corona at the poles, and most of it flows around the Sun, and out on the equatorial current sheet.
Only a fraction of the current makes it down to the surface of the Sun, causing ongoing arc discharge (lightning bolts) all over the surface of the Sun, producing radiation. It turns out that the circuit characteristics of the current that reaches the surface of the Sun are precisely the same as the characteristics of a transistor. Thus, the amount of current reaching the Sun is carefully regulated and kept at a constant level.
Electric climate
Along one particular current filament, ‘our’ filament, are arranged a number of stars, including our own Sun. Some fraction of that current reaches the Earth’s ionosphere, and the intensity of that fraction varies with the intensity of the filament’s current. If a surge of current comes down the filament, the Earth will experience a corresponding surge of incoming current.
It is easy to understand why a current flowing through the Earth system causes heating. The Earth system, including the ionosphere, functions as a resistor in the solar current sheet. Resistors always heat up, essentially from friction, and the degree of heating varies with the intensity of the current. A surge of current, coming in from the cosmos along the filament, will cause a spike of heating here on Earth.
Author note, 29 March 2017: This article, Supersonic Plasma Jets Discovered, was recently published by the European Space Agency. In it we read, “Information from ESA’s magnetic field Swarm mission has led to the discovery of supersonic plasma jets high up in our atmosphere that can push temperatures up to almost 10,000°C”.
Thus, the spiky pattern of the Earth’s climate variation could be due to current surges on the filament that powers the Sun. But is there any reason to expect that surges would come in semi-regular spikes, over a wide range of frequencies and intensities? As a matter of fact, there is very good reason to expect exactly that.
Every time there is a discharge event, such as a super nova, the event sends a spike of current, essentially a lightning bolt, down its particular current filament. Then that discharged singularity begins charging up again, acting as a capacitor, and there will be another similar current spike when it discharges again later, according to its semi-regular recharge cycle.
A ‘pulsar’ is a semi-regular discharge event, with a very high frequency, sending current spikes down its filament like a rapid-fire machine gun. In our image of the Stellar Nursery, we see an immense discharge event, but one that is unfolding on a very long time scale. The current spike it is sending down its filaments will take eons to peak, before it begins to lose energy, and eventually stops emitting visible light.
Electric discharge events in the cosmos create semi-regular current spikes, over a wide range of frequencies and amplitudes, and the Earth is connected to a circuit that is subject to such discharge events. The temperature record of Earth is characterized by heating spikes, which would be an expected result of current spikes. Based on these observations, I put forward the following hypothesis:
The spiky, fractal pattern of Earth’s climate variation can be accounted for by semi-regular discharge events that occur either on the Sun’s own current filament, or somewhere in the web of filaments to which that filament is connected.
SOURCES
Vostok ice-core dataset
Greenland ice-core dataset
Thunderbolts Project
Thunderbolts Project YouTube channel
The Essential Guide to the Electric Universe
Artist image of ‘solar wind’
All other images are from videos on the Thunderbolts Project website.